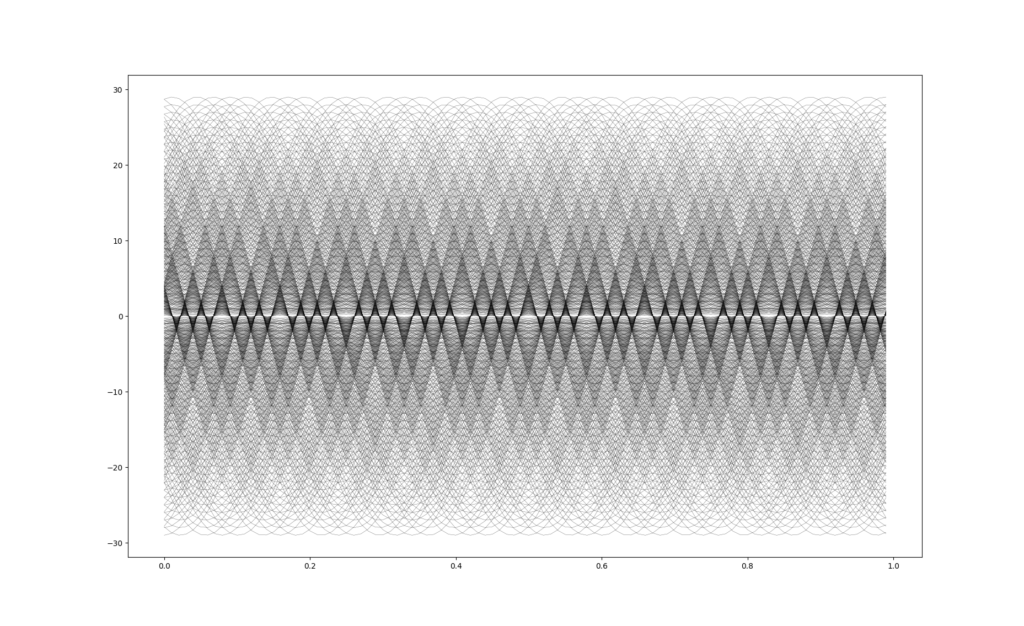
Using numpy and matplotlib, a sequence of sinusoids can be created, like a piece of art.
In this case, a nested iteration allows to overlay each plot over each other with an offset value that comes from the looping control variables.
Below the code and the result
from numpy import *
from matplotlib import *
from matplotlib.pyplot import *

t = arange(0.0, 1.0, 0.01)

fig = figure(1)

fig1 = fig.add_subplot(111)
#fig1.plot(t, sin(2*pi*t))
#fig1.grid(True)

for i in range(1,20):
	for j in range(1,30):
		fig1.plot(t, j*sin(2*pi*t/0.5+(i)), linewidth=0.2, color='black')

show()

